
Case study · BI reporting
Sales & Performance Dashboards
Sales performance visualisation and KPI framework for Volvo Trucks (Iran), 2017–2018. Fragmented sales data across multiple systems was turned into a unified reporting model with consistent KPIs and visual clarity on performance trends.
Company
Volvo Trucks (Iran)
Date
2017–2018
Role
Sales Engineer / Reporting Analyst
Tools
Excel · Access · Power Query · Power BI
The challenge
Sales data was fragmented across multiple systems, with limited reporting. Senior stakeholders needed consistent KPIs and visual clarity on performance trends.
My contribution
I created a unified reporting model using Excel and Access, introduced Power Query for automated transformation, and built an interactive Power BI dashboard for visualising key sales trends by region, vehicle category, and time.
Business impact:
- 40% reduction in manual reporting time
- Improved quarterly forecasting and dealer-level comparisons
- Enabled strategic decisions around pricing and inventory based on visual KPI dashboards
Skills: Data modelling, dashboard automation, performance reporting, trend analysis.
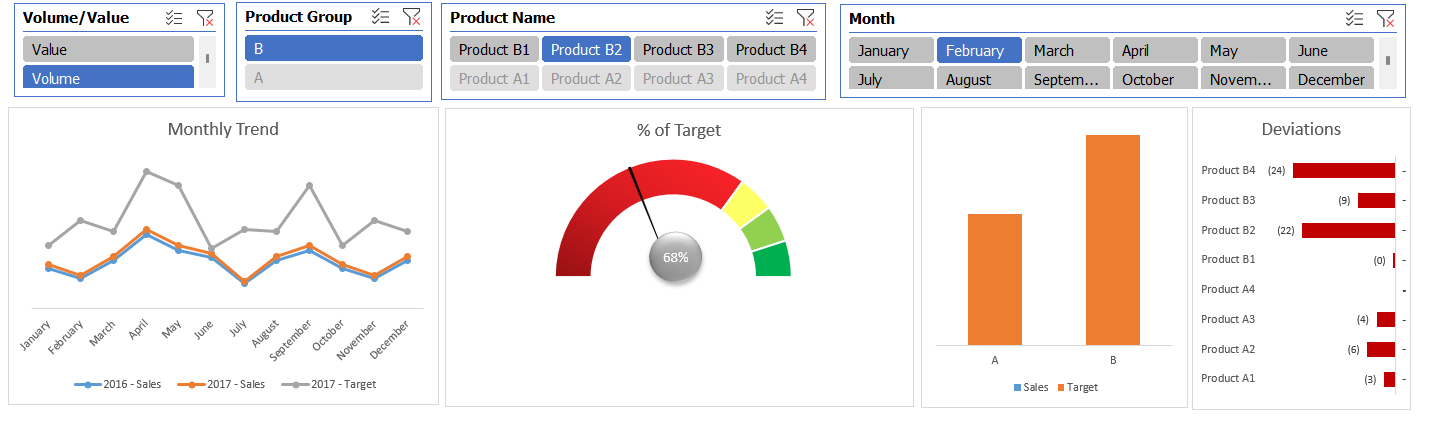
Dashboards
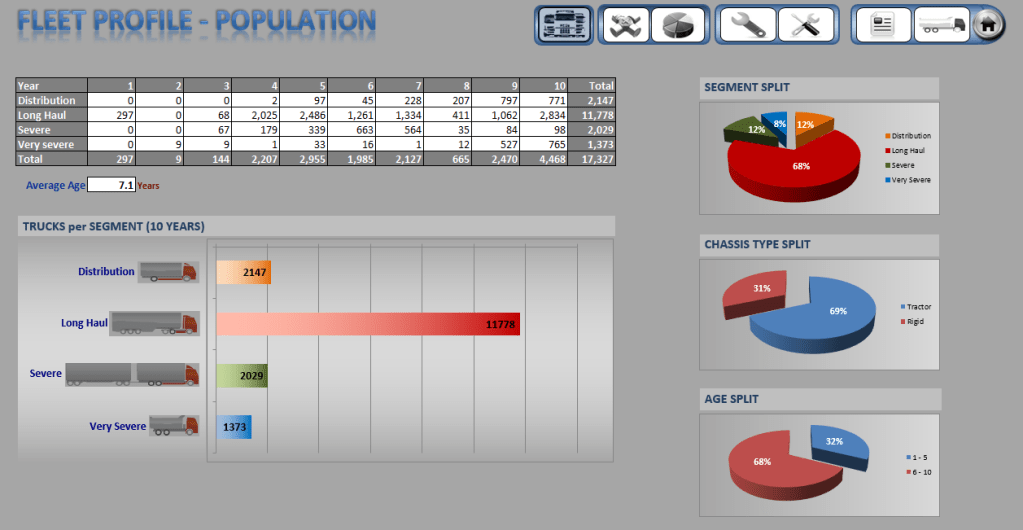
Strategic Dashboard: Segment, Chassis & Age Split (2017)
To support high-level forecasting and investment decisions, I developed this dashboard showcasing three key perspectives: operational segment split (68% Long Haul), chassis type breakdown (69% Tractors), and age group analysis (68% of trucks aged 6–10 years).
These insights enabled the parts and service team to anticipate high-consumption categories and adjust procurement strategy accordingly. The combination of operational classification and lifecycle timing helped guide long-term resource planning.

Fleet Profile Analysis – Volvo Trucks Population (2017)
I analysed the total active population of Volvo trucks in the country over a 10+ year lifecycle, segmented by usage severity (Distribution, Long Haul, Severe, Very Severe). The dataset covered 42,677 units, categorised by age and duty cycle to inform aftersales investment strategy and inventory planning.
Key insight: Over 28,000 units (≈66%) were more than 10 years old, with a dominant share (16,029) under “Severe” usage. This highlighted a high-opportunity segment for wear-intensive parts and service campaigns.
The analysis directly supported forward-ordering strategies for high-demand segments, helping maximise ROI and align stock with lifecycle needs.

Market Share Analysis – Genuine Bearing Sales (2017)
This project illustrates my contribution to analysing sales performance and identifying untapped market potential for one of the company’s strategic parts segments in 2017.
Using structured reporting and Excel-based modelling, I compared actual retail part sales (€92,929.3) against the total parts market potential (€406,310.1), revealing a 77.1% lost market opportunity.
The insight guided sales planning for the following year, informing order prioritisation, investment allocation, and pricing strategies aimed at maximising returns in high-gap segments.
The report also served as a strategic input for defining realistic market share growth targets.

