Case study · BI reporting
User Funnel Analysis & KPI Reporting
With multiple social platforms driving different types of engagement, the marketing team needed a unified way to track, compare, and act on campaign performance. This dashboard provided the clarity required to align efforts, measure impact, and refine strategy.
4
platforms unified
12%
Instagram Reels CTR (highest)
5,505
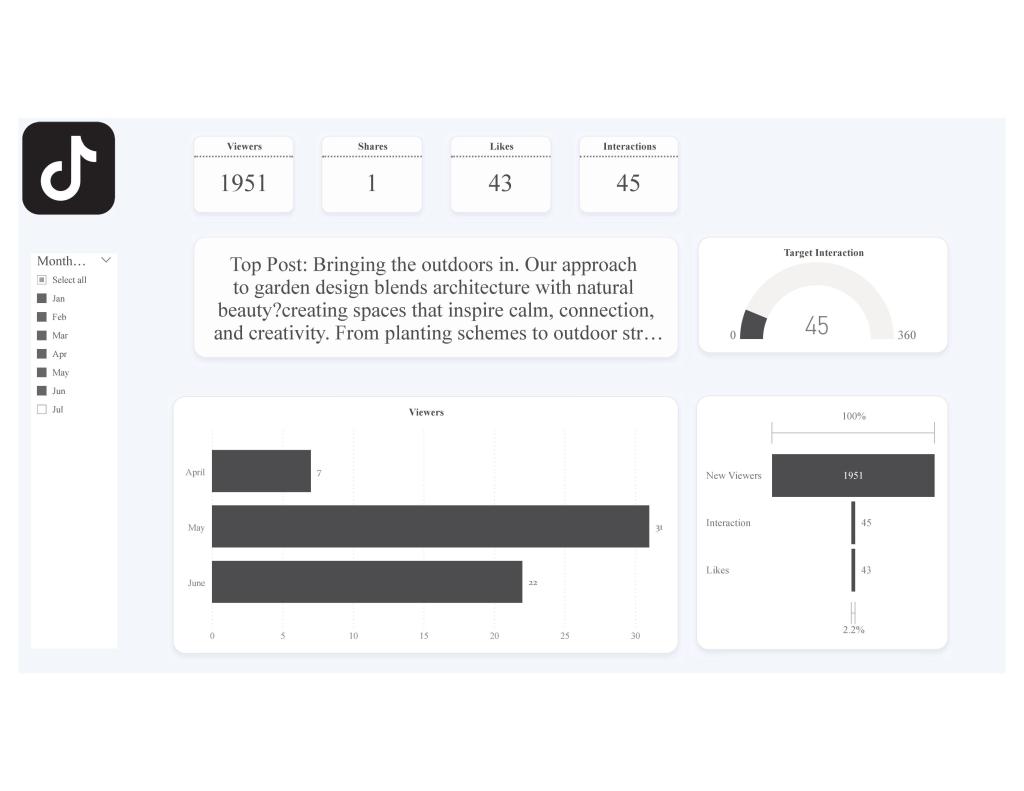
TikTok impressions (led)
The challenge
Each platform, Instagram, TikTok, Pinterest and YouTube, offered isolated analytics, and the team lacked an integrated view of engagement performance, reach, and conversion. Insights were fragmented, making cross-platform comparison nearly impossible and decision-making reactive rather than data-led.
My role
I led the creation of a multi-channel dashboard using Power BI. My process included:
- Collecting and cleaning campaign metrics across four platforms
- Segmenting each platform into its own tab for clear deep-dive navigation
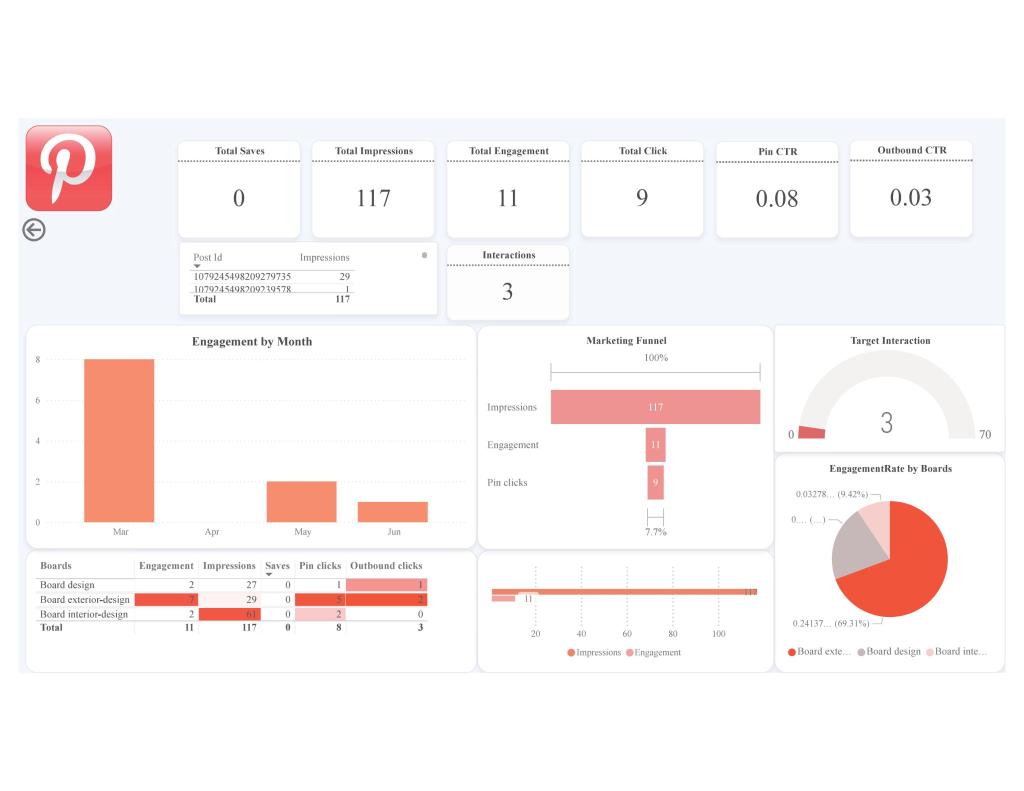
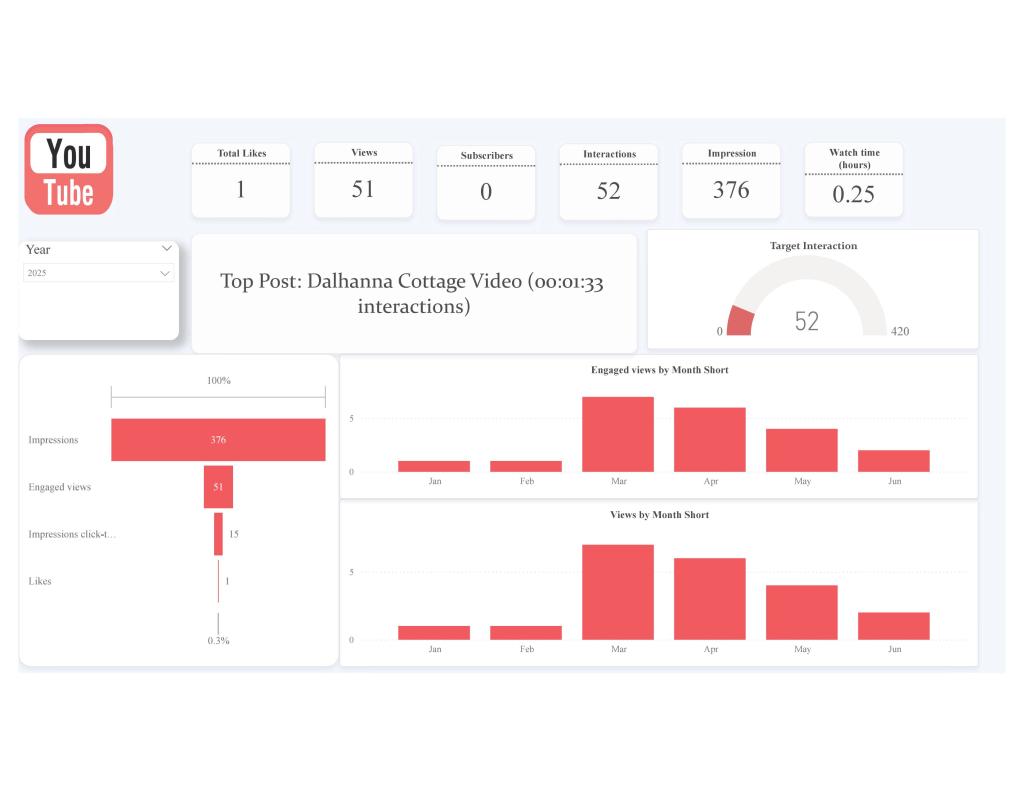
- Standardising KPIs such as impressions, interactions, CTR, reach, and saves
- Designing custom visuals to track month-over-month performance, content types, and peak interaction times
What changed
- Provided a single source of truth across channels
- Helped identify that Instagram Reels had the highest CTR (12%), while TikTok led in total impressions (5,505)
- Visualised user interaction trends per day and hour, enabling posting strategy optimisation
- Tracked progress against monthly engagement targets
- Allowed granular analysis (e.g. IG image vs carousel vs reel) and board-specific funnel in Pinterest
Tools used: Power BI · Meta Insights · YouTube Studio · Pinterest Analytics
Skills applied: Data consolidation · Funnel tracking · UX visualisation · Multi-platform reporting


 Hoda Rezvanjoo