Work
Tools built and deployed.
Applied decision systems, BI infrastructure, and market intelligence tools — each designed to produce outputs organisations can act on directly.
Constraint Optimisation · Marketing Technology
Digital Budget Optimisation Engine
A constraint-based linear programming system that allocates marketing budget simultaneously across four platforms and four objectives, tracking 16 KPI variables. Architecture includes a sequential state machine enforcing decision integrity at each step, a cost-per-unit transformation layer, a scenario engine producing conservative, base, and optimistic outputs, and a decision interpretation layer generating structured recommendations for non-technical stakeholders.
Evaluated as a pilot over three months: approximately 40% reduction in manual coordination effort and 15% improvement in platform performance metrics — confirmed in a formal letter from the Operations Manager.
Python · PuLP · Linear Programming · Streamlit · State Machine · Scenario Analysis
Market Decision Intelligence · NHS · MedTech
Heagital Market Decision Engine
Ranks all 42 NHS Integrated Care Boards across three weighted dimensions: Clinical Risk (45%), Adoption Readiness (35%), and Procurement Friction (20%). Min-max normalisation applied before scoring. Four named scenario configurations test ranking sensitivity under different NHS procurement assumptions. Full pipeline runs from a single CLI command, producing a ranked CSV — reproducible and auditable against public NHS QOF source data.
Outputs adopted at board level: informed Heagital’s pilot region selection — Midlands, South West, South East — covering 53.4% of national addressable opportunity. Documented on slide 8 of the current seed investment pitch deck.
Python · Weighted Scoring Model · NHS QOF Data · CLI Pipeline · Min-Max Normalisation
Risk Intelligence · ISO 14971 · MedTech
Predictive Risk Assessment Framework
A risk intelligence system for early-stage point-of-care device development. Pattern-based scoring across likelihood, impact, and detectability with a full audit trail and decision gate guidance. Designed to support ISO 14971-aligned risk management as part of Heagital’s NHS regulatory pathway — embedded into the device development process rather than applied retrospectively.
Integrated into Heagital’s regulatory pathway for a connected PT INR point-of-care testing solution targeting institutional and community NHS settings.
Python · ISO 14971 · MedTech · Audit Trail · Decision Gates
ISO 14971 · MedTech Regulatory
Business Intelligence · Sales Analytics
Volvo Intelligence Hub
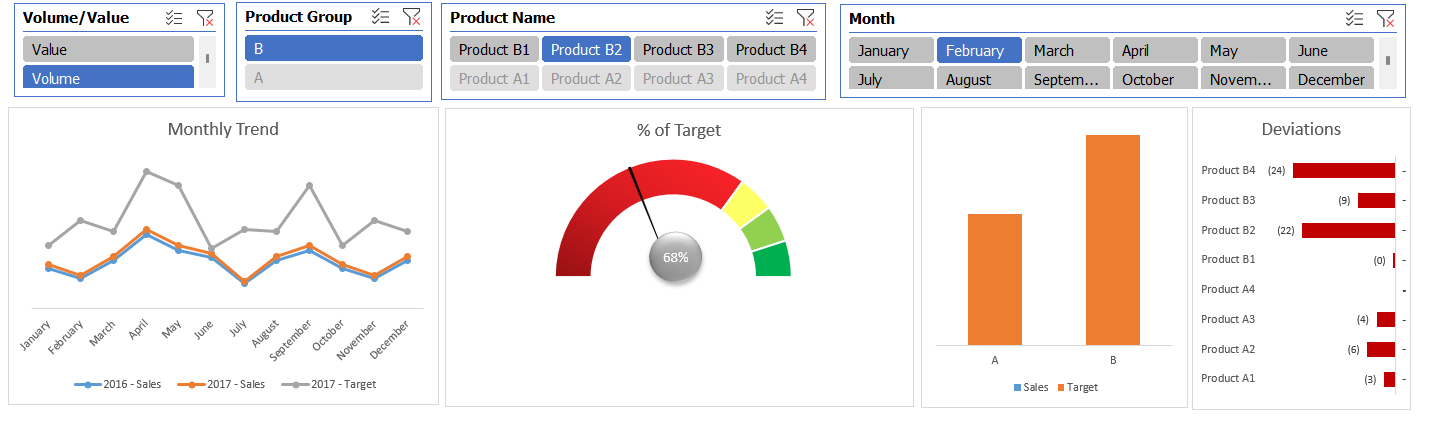
A Python-built browser dashboard consolidating disconnected sales and inventory data into a single filterable view. KPI-driven logic flags high-risk inventory automatically. Auto-generated written insights adapt to every filter selection — built for users who need conclusions, not raw data. Built as a simulated case using Volvo Trucks 2017–2018 sales data.
Fragmented Excel files unified into a live interface with regional and category filters, automated KPI scoring, and narrative insight generation. No manual analysis required post-deployment.
Python · Streamlit · Pandas · KPI Logic · Auto-Insights
Sales Intelligence · Automotive · Volvo Trucks Iran
Sales & Performance Dashboards
Transformed fragmented sales data from Volvo Trucks Iran (2017–2018) into a unified reporting model using Excel, Access, Power Query, and Power BI. Delivered dashboards covering KPIs by region, vehicle category, and time period. Conducted lifecycle analysis of 42,677 units by usage severity, and market share analysis revealing a 77% gap between actual and potential parts revenue.
40% reduction in manual reporting time. Parts gap analysis informed pricing strategy and order prioritisation for the following year. Fleet lifecycle findings directly supported forward-ordering for high-demand service segments.
Power BI · Power Query · Excel · Access · Trend Analysis
Marketing Analytics · Multi-Platform
User Funnel Analysis & KPI Reporting
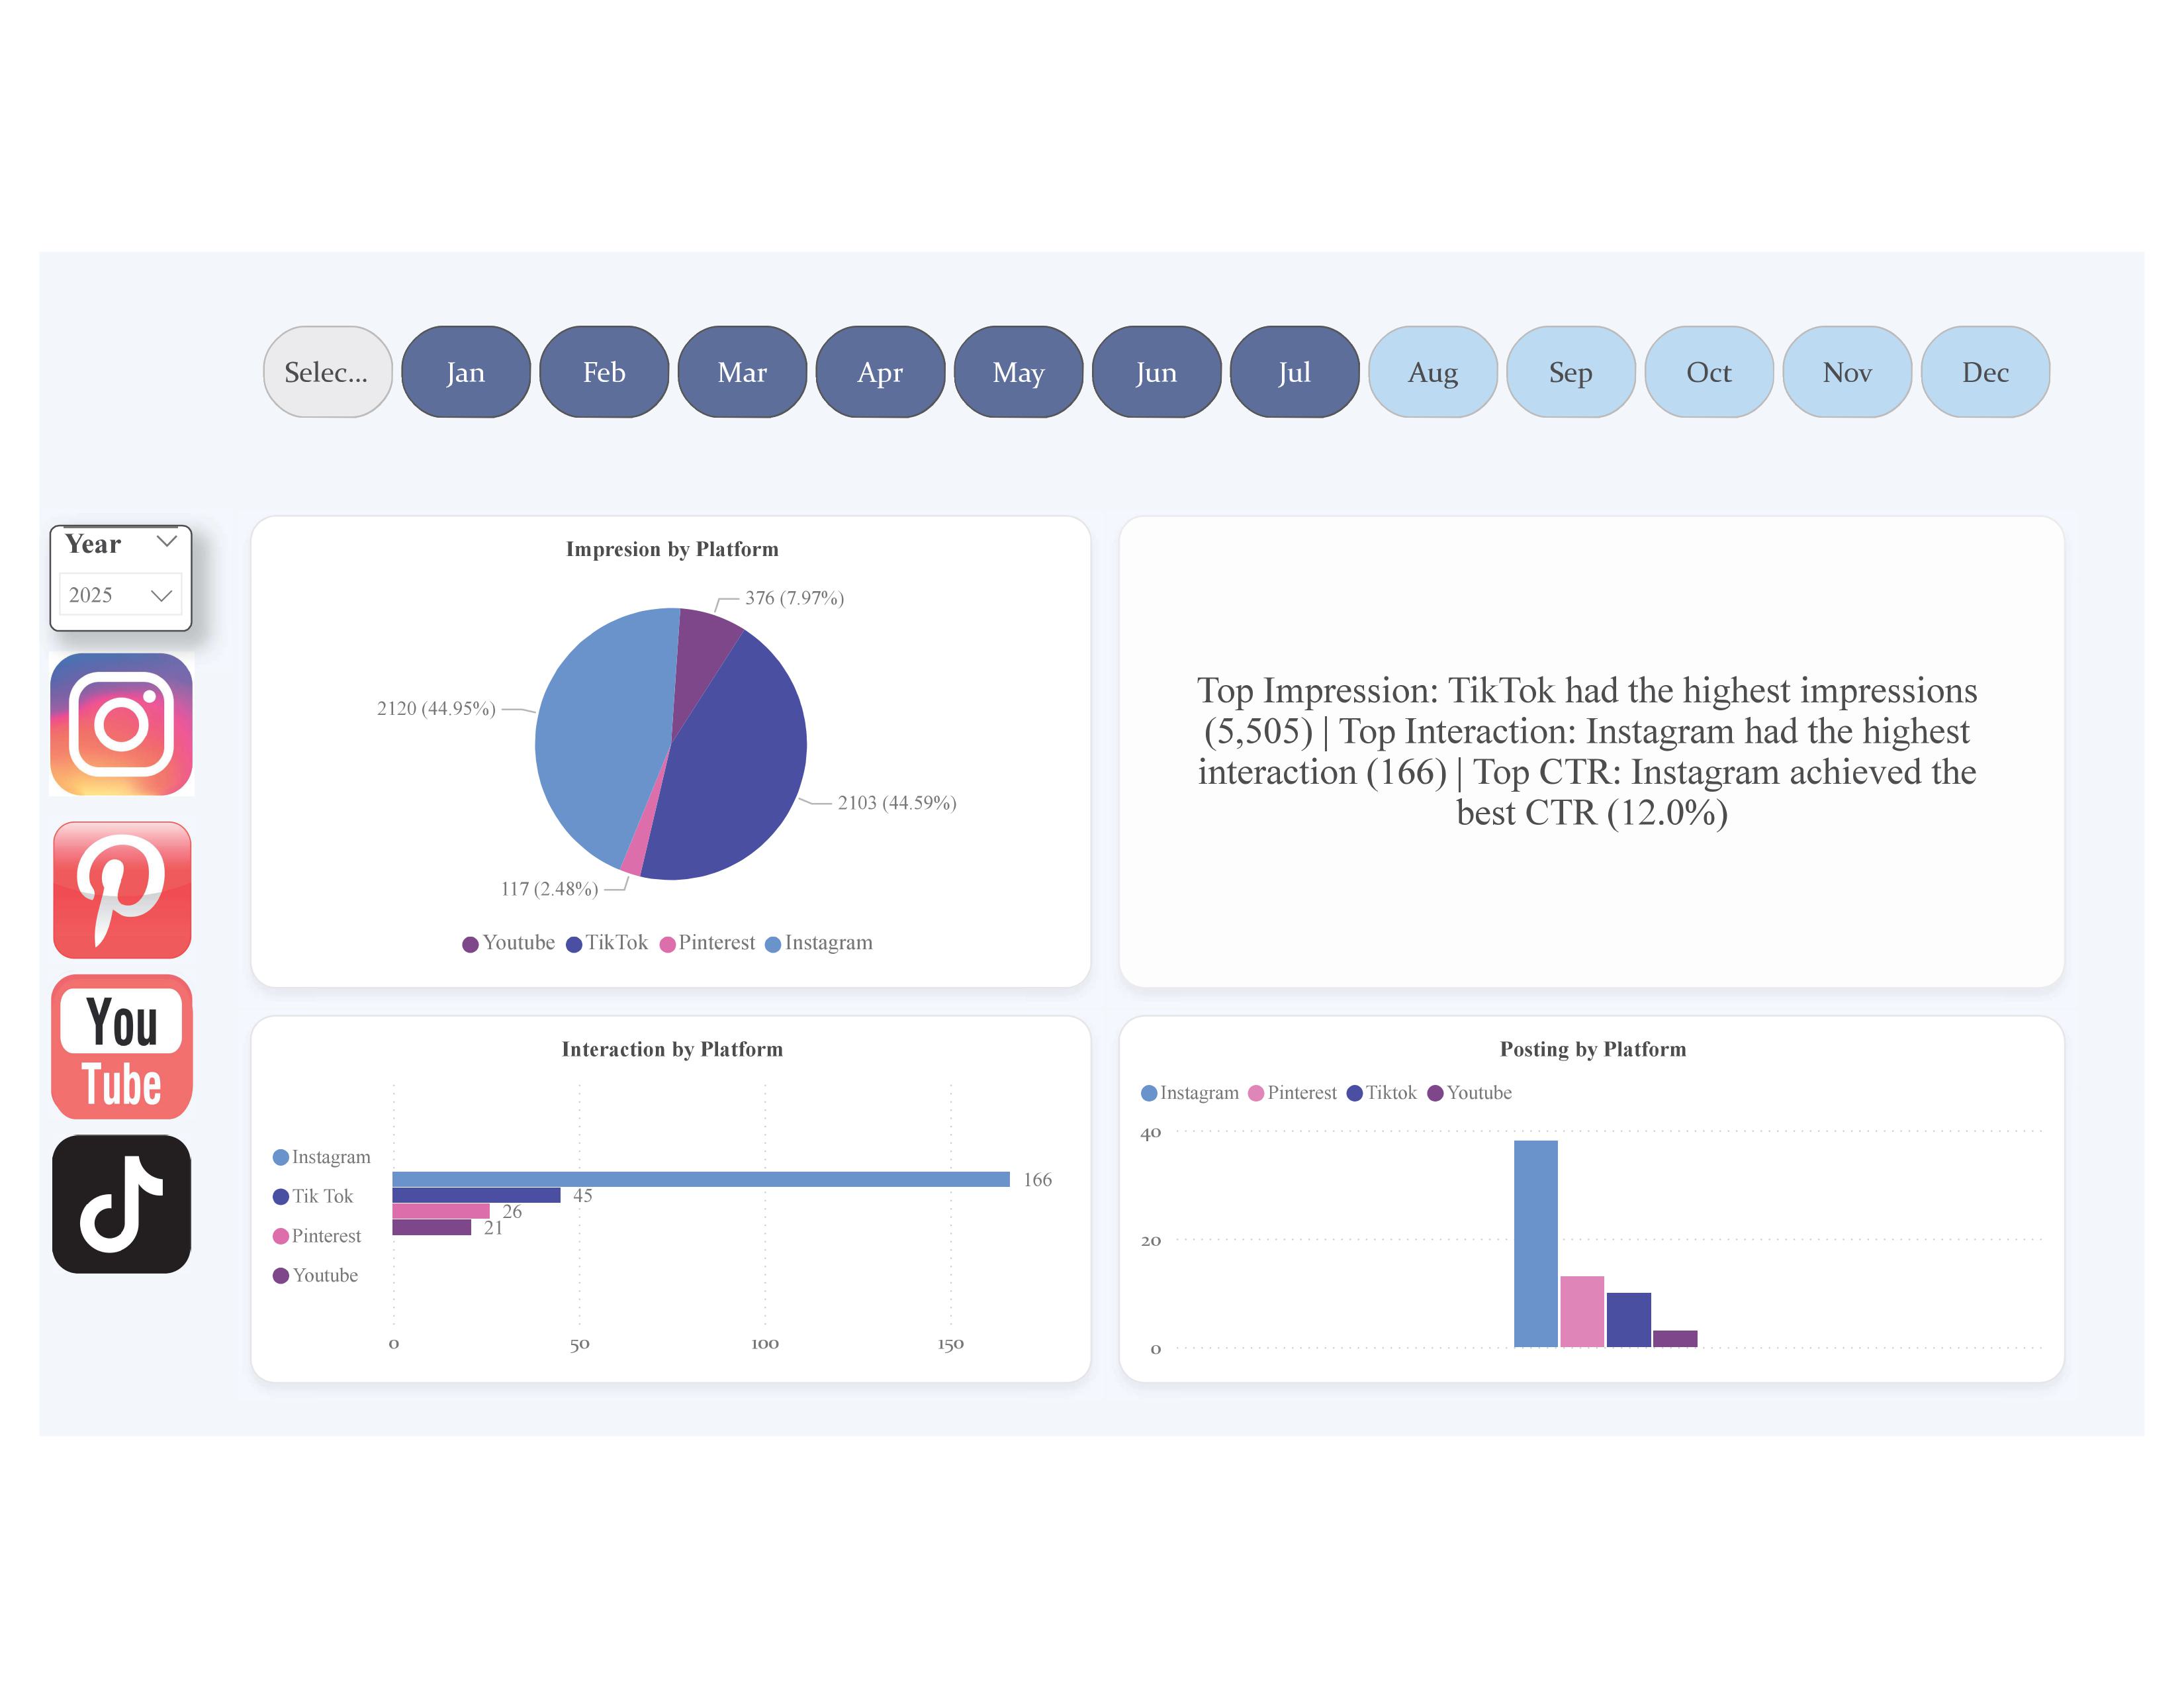
Built a unified Power BI dashboard consolidating campaign data from Instagram, TikTok, Pinterest, and YouTube — replacing isolated platform analytics with a single cross-channel view. Each platform has its own deep-dive tab. Standardised KPIs enable direct comparison. Month-on-month performance, content-type breakdowns, and posting-time heatmaps replaced reactive reporting.
Instagram Reels: 12% CTR. TikTok: 5,505 total impressions. Single source of truth replaced fragmented platform reporting and enabled posting strategy optimisation based on peak engagement data.
Power BI · Meta Insights · YouTube Studio · Pinterest Analytics · Funnel Analysis